

Key Components
Prometheus:
Prometheus is a free software application used for event monitoring and alerting. It records metrics in a time series database built using an HTTP pull model, with flexible queries and real-time alerting.
Grafana:
Grafana is a multi-platform open source analytics and interactive visualization web application. It can produce charts, graphs, and alerts for the web when connected to supported data sources. In our use case, Prometheus is the data source in Grafana.
Exporters:
Exporters transform metrics from specific sources into a format that can be ingested by Prometheus.
Overview
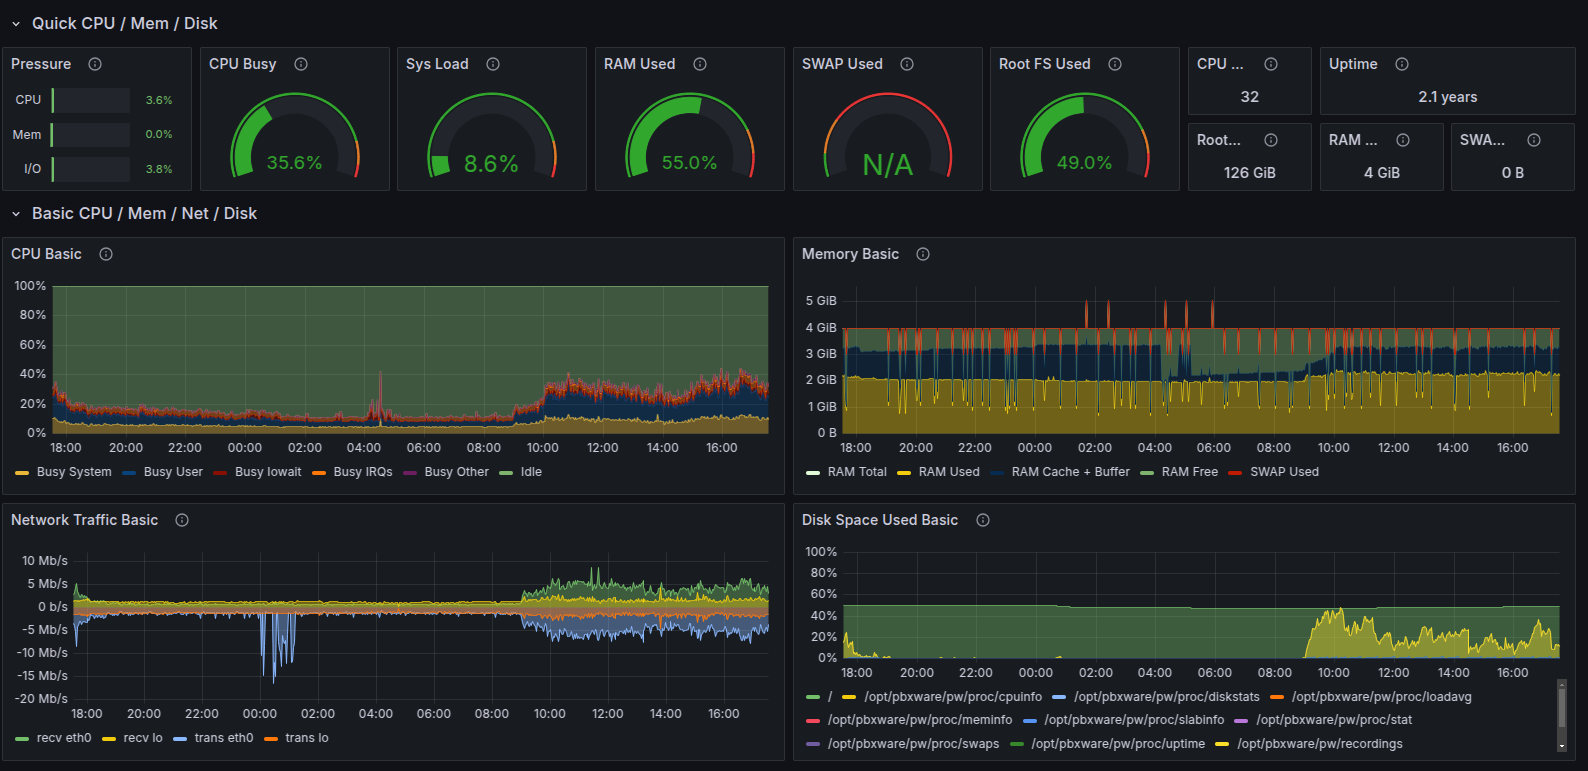
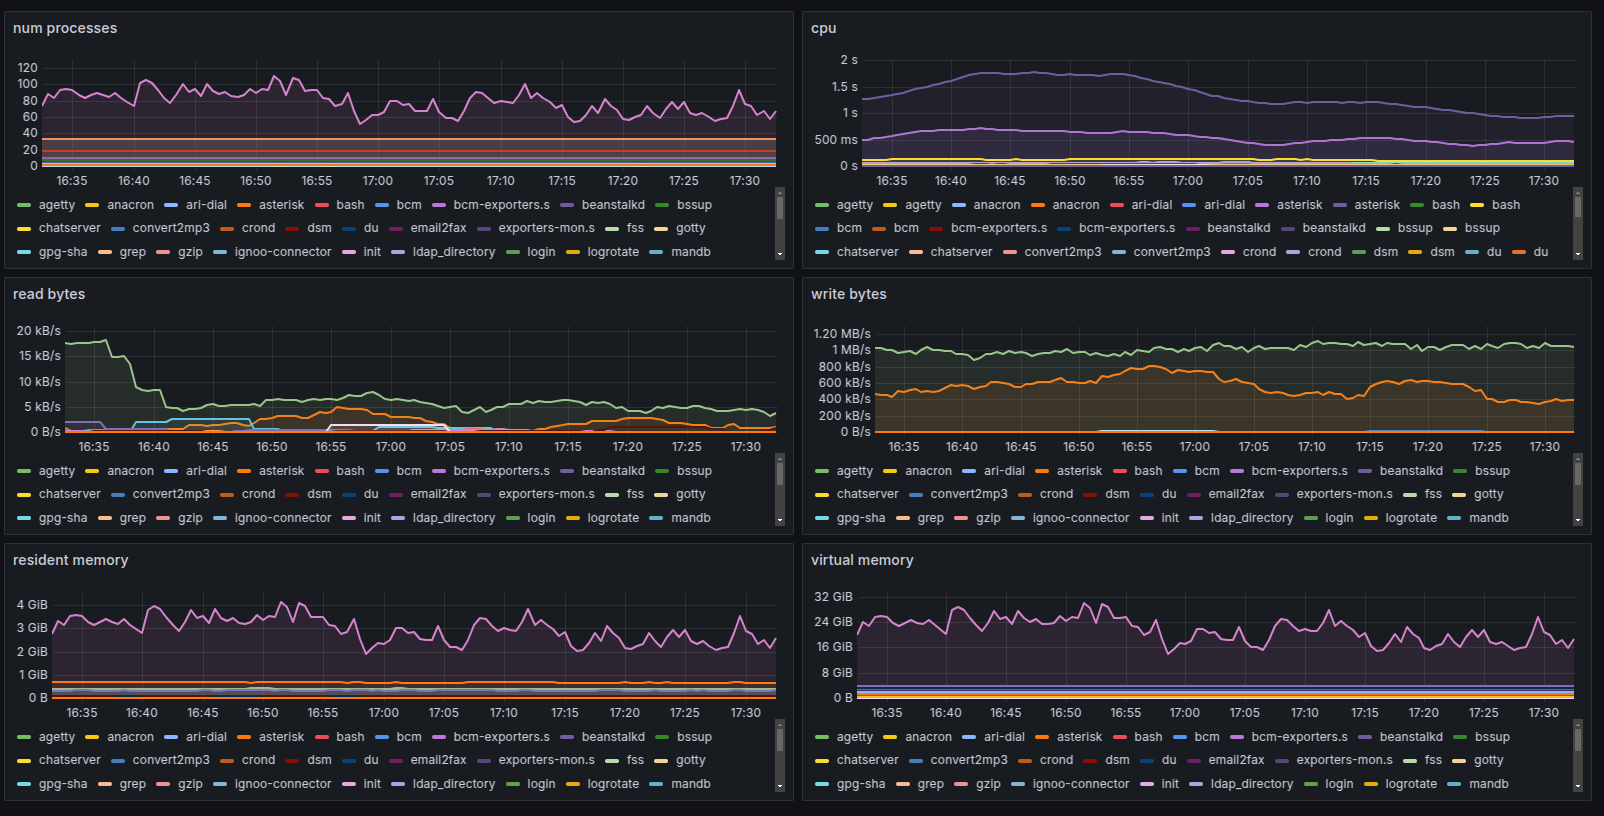
In certain circumstances where customer systems, for example, keep locking up due to CPU/RAM spikes and the logs on the system and/or host do not offer much information, we can add them to our hosted Prometheus + Grafana instance for monitoring, which looks like this:
How it works
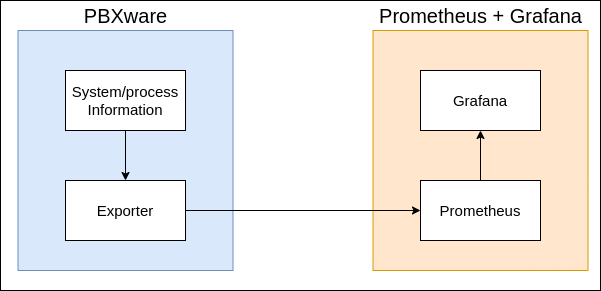
Exporters collect system information and expose it as raw data on specific ports which Prometheus collects in intervals and feeds to Grafana:
Adding systems for monitoring
Adding a system for monitoring involves deploying the exporters on the remote system, adding it in the Prometheus configuration file and reloading/restarting Prometheus to fetch the new configuration.
Please note that exporters do not send data to Prometheus. Prometheus collects the data from the remote systems, which means that ports 9100 (node-exporter) and 9256 (process-exporter) must be accessible from the Prometheus + Grafana instance.
Step 1
We have to edit the prometheus.yml file in /etc/prometheus and add the remote system's IP address for both the node-exporter and process-exporter jobs. In this example we will add a system with the IP address of 192.168.1.55 (we will pretend that 192.168.1.44 is a system that was previously added and is already being monitored):
# my global config
global:
  scrape_interval: 15s # Set the scrape interval to every 15 seconds. Default is every 1 minute.
  evaluation_interval: 15s # Evaluate rules every 15 seconds. The default is every 1 minute.
  # scrape_timeout is set to the global default (10s).

# Alertmanager configuration
alerting:
  alertmanagers:
    - static_configs:
        - targets:
          # - alertmanager:9093

# Load rules once and periodically evaluate them according to the global 'evaluation_interval'.
rule_files:
  # - "first_rules.yml"
  # - "second_rules.yml"

# A scrape configuration containing exactly one endpoint to scrape:
# Here it's Prometheus itself.
scrape_configs:
  # The job name is added as a label `job=<job_name>` to any timeseries scraped from this config.
  - job_name: "prometheus"

    # metrics_path defaults to '/metrics'
    # scheme defaults to 'http'.

    static_configs:
      - targets: ["localhost:9090"]

  - job_name: "node-exporter"
    static_configs:
      - targets: ["192.168.1.44:9100","192.168.1.55:9100"]

  - job_name: "process-exporter"
    static_configs:
      - targets: ["192.168.1.44:9256","192.168.1.55:9256"]
Important note:
The syntax of the configuration file is quite sensitive, so you must make sure to add a comma when appending/adding a new system to the list and put it in double quotes.
Step 2
Now we need to deploy the exporters on the remote system.
Luckily, this step has been automated with the bcm-exporters bash script which does the following:
- Downloads and extracts the exporter binaries and moves them to /usr/bin,
- Creates an /etc directory and configuration file for process-exporter,
- Adds iptables rules so that only our hosted Prometheus + Grafana instance has access to ports 9100 and 9256,
- Creates a monitoring script for the exporters in /opt to restart them if the system gets rebooted or they crash for some reason. The monitoring scripts also implements logging for the binaries so that we can keep track of when/why they have stopped or crashed.
- Adds a cronjob to run the monitoring script every minute,
- Lastly, starts the exporters.
The entire deployment can be done with the following command:
curl https://downloads.bicomsystems.com/support-group/edvin/exporters-install.sh | bash
Step 3
The last step is to reload/restart Prometheus so that it fetches the updated configuration and starts collecting the data from the newly added system.
Reloading Prometheus should be the first choice here. We should only restart it in case reloading did not work out.
To reload Prometheus, we need to send a SIGHUP (hang-up) signal to the process:
kill -s SIGHUP $PID
You can retrieve Prometheus' PID with pgrep or ps, whichever way you prefer.
To restart Prometheus, we can simply restart the systemd service:
systemctl restart prometheus